21 September, 2020 (Bloom, bgd, Legacy-(NBE IAV))
Bloom, A. A., Bowman, K. W., Liu, J., Konings, A. G., Worden, J. R., Parazoo, N. C., Meyer, V., Reager, J. T., Worden, H. M., Jiang, Z., Quetin, G. R., Smallman, T. L., Exbrayat, J.-F., Yin, Y., Saatchi, S. S., Williams, M., and Schimel, D. S.: Lagged effects dominate the inter-annual variability of the 2010–2015 tropical carbon balance, Biogeosciences Discuss., https://doi.org/10.5194/bg-2019-459, in review, 2020.
Overview
This paper uses a simple but unique calculative technique to disentangle change in a flux (i.e. NBE) into lagged effect of climatology and concurrent meteorological anomaly effect. This methodology is different from the SAM framework by Ogle et al., in which the legacy effect is quantified by getting weight factor of each environmental covariate.
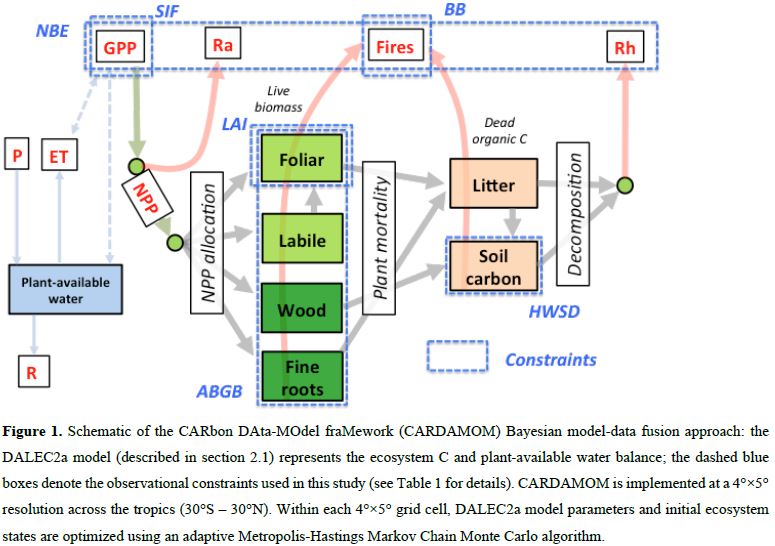
The authors quantified the contribution of the lagged effect on the total change in NBE and further decomposed the lagged effect into related diagnostic states (i.e. NBE = Rh + Fire - NPP). In addition, they disaggregated the lagged effect on the total annual NBE change into relevant ecosystem states (i.e. Foliar C, Soil C, SWC, and others).
Because the DALEC2a model contained only one pool related to water cycle (plant available water, SMC), this study could quantify the effect of water pool on ecosystem production only in terms of SWC. However, the methodology here could be applied to other (more complex) models as the authors told, implying that interactions between more various sets of carbon and water pool could be investigated.
With this implication, I would be interested in applying the methodology to SINDBAD framework.
Decomposing into LAG and CON
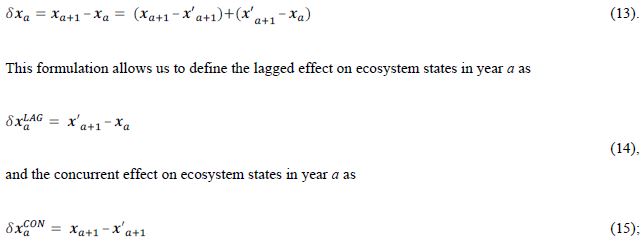
The authors quantified the lagged effect by introducing the state x of the monthly climatological mean meteorological drivers.
Thereby,
- lagged effect in year a stands for mean climatological state x in a+1 subtracted by state x in year a (eq. 14)
- concurrent effect in year a stands for state x in year a+1 subtracted by mean climatological state x in a+1 (eq. 15)
and the two effects constitute the total change in state x in year a (eq. 13)
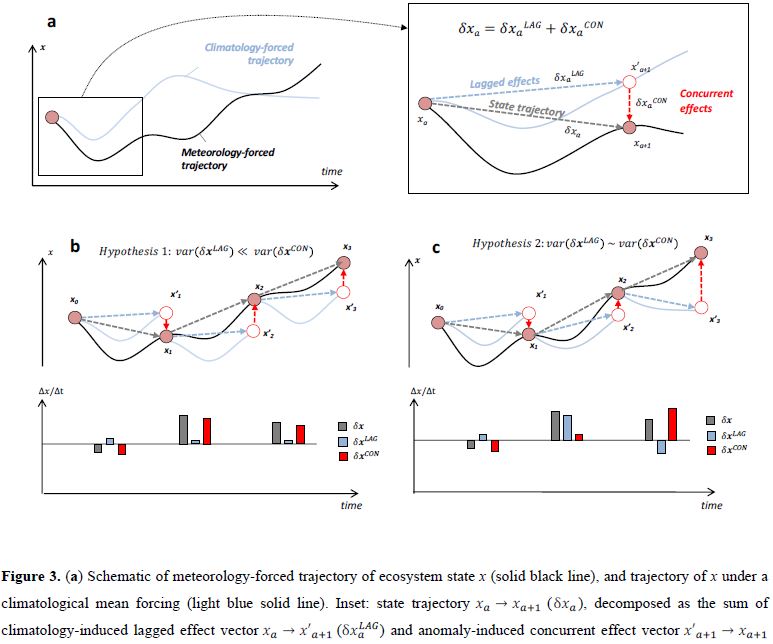
Key Results
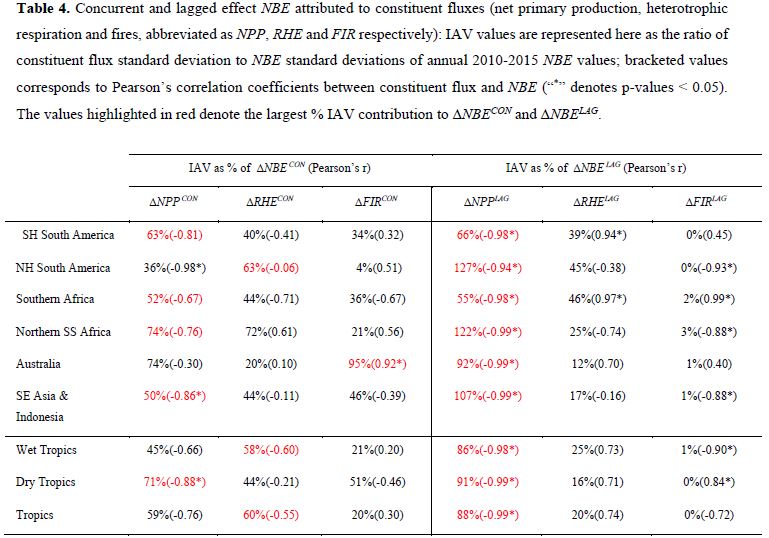
Table4:
- There were substantial amount of lagged effects.
- NBE anomalies in lagged and concurrent effects were mostly influenced by NPP anomalies.
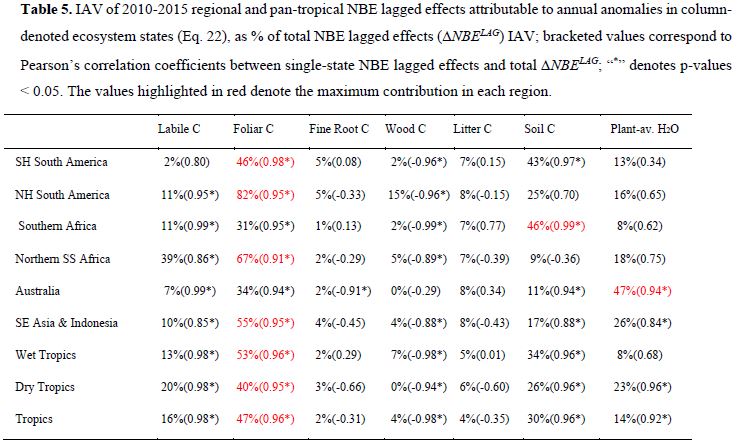
Table5:
- The NPP anomaly variability was mostly explained by Foliar C.
- Foliar C, Soil C, and SMC were sufficient to explain the variability of heterotrophic respiration.
- Fine root C, Wood C, and Litter C showed a little influence to Rh.
Etc…
- Schematic of the CARDAMOM framework (a DA framework) and DALEC2a model structure.
- Why did not they decompose concurrent anomalies?
- bc. their interest was the lagged effect?
- In around line 515, they explained that “the enhanced foliar C in 2011 … attributable to a combination of reduced fires and increase productivity…” but both fires (Fig. S2) and production (Fig. 5) increased in 2011 over the Australian continent. …
- Different conclusion would be derived with different study period given that the lagged effect is dependent to the meteorological anomalies.