18 September, 2020 (Humphrey, nature, TWS-[CO2])
Humphrey, V., Zscheischler, J., Ciais, P. et al. Sensitivity of atmospheric CO2 growth rate to observed changes in terrestrial water storage. Nature 560, 628–631 (2018). https://doi.org/10.1038/s41586-018-0424-4
Overview
This paper provides observational evidence that the inter-annual variation (IAV) of CO2 growth rate (CGR) is strongly coupled to changes in both terrestrial water storage (TWS) and temperature at the global scale. It uses GRACE product, satellite observations of TWS, and measurements of CGR from NOAA. In addition, the authors compares their results with those by Jung et al. (2017), which is a root of my PhD project. The comparison reveals that the global CGR is more related to TWS rather than temperature, which counters Jung et al. (2017)‘s results. This contradictory is triggered by less sensitive response of DGVMs in the TRENDY project, calling further improvements.
Although confirming the global relationship between CGR IAV and TWS, this study does not explain the mechanism behind the relationship.
CGR IAV is strongly sensitive to TWS at the global scale.
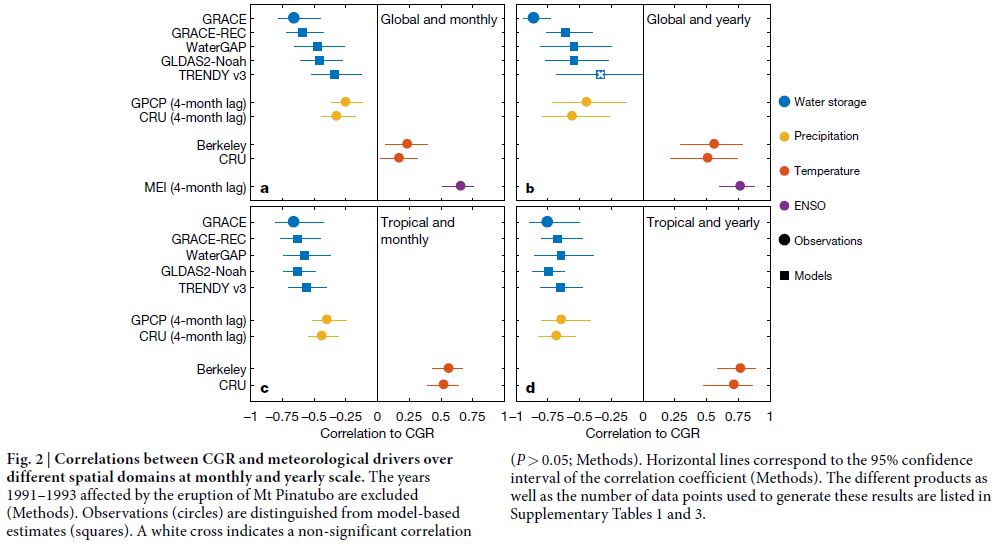
Figure 2:
- TWS shows a strong correlation with CGR.
- Temperature is more strongly correlated with CGR in tropics.
- ENSO is associated with large-scale fluctuations in precipitation, which ultimately translate into water storage anomalies.
CGR IAV shows higher partial correlation with TWS than temperature.
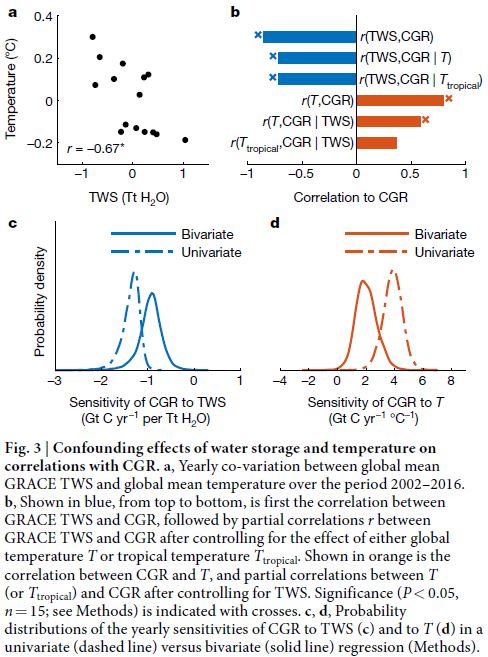
Figure 3:
- The global CGR-TWS relationship remains significant after controlling for the effect of temperature (b, blue bars.
- A 28% decrease (-0.93 Gt C yr-1 per Tt H2O)
- The global CGR-Temperature shows more reduction after controlling for the effect of TWS (b, red bars).
- A 49% decrease (1.99 Gt C yr-1 per degC)
- Global yearly sensitivity is -1.33 Gt C yr-1 per Tt H2O (= -1.3 g C yr-1 per kg H2O)
Models underestimate the magnitude of (soil) water-driven NEE IAV.
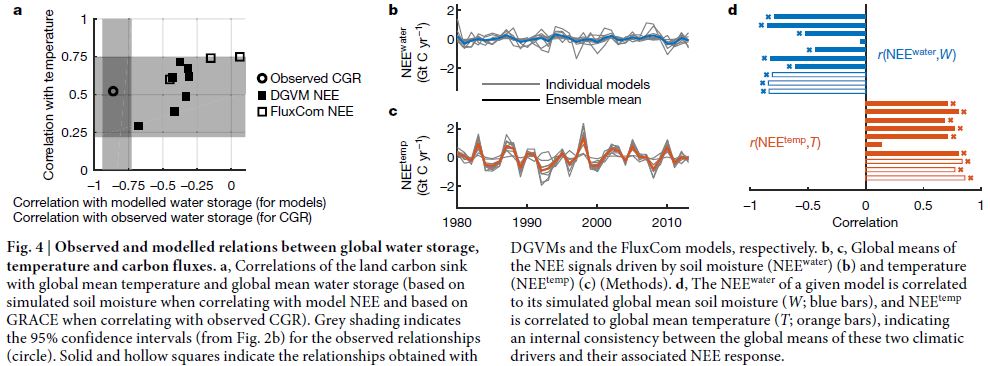
Figure 4:
- a models fails to reproduce the observed correlation between CGR and temperature (squares).
- This leads to a different conclusion by Jung et al. (2017).
- b, c models underestimate the magnitude of (soil) water-driven NEE IAV.
- Most DGVMs represent root zone soil water pool.
- Weak representation of water pools with much longer residence time (e.g. deep soil layers, groundwater, wetlands, and surface water)
- Modelled NEEwater has an upper limit.
- errors in the precipitation forcing
- Nevertheless, models also show a global TWS-NEEwater relationship, which supports the result here.
Methodology
Data
- GRACE TWS
- 2002 ~
- monthly, ~300 km
- relative changes in water storage
- groundwater, soil moisture, surface waters, snow, land ice, and biosphere water pools
- GRACE-REC: a statistical reconstruction of GRACE to estimate past TWS anomalies.
- forced with precipitation and temperature
- NOAA/ESRL
- weekly GCR observation since 1980
Analysis
- Isolate IAV: by removing seasonal cycle and the linear trend
- Land area analysis: to exclude Greenland and Antarctica
- Jung et al. (2017)‘s method
- …