12 April, 2021 (Vishwakarma, erl, the_TVR_metric)
Vishwakarma, B. D., Bates, P., Sneeuw, N., Westaway, R. M., & Bamber, J. L. (2021). Re-assessing global water storage trends from GRACE time series. Environmental Research Letters, 16(3), 034005. https://doi.org/10.1088/1748-9326/abd4a9
Message: the variability should be considered together with trend.
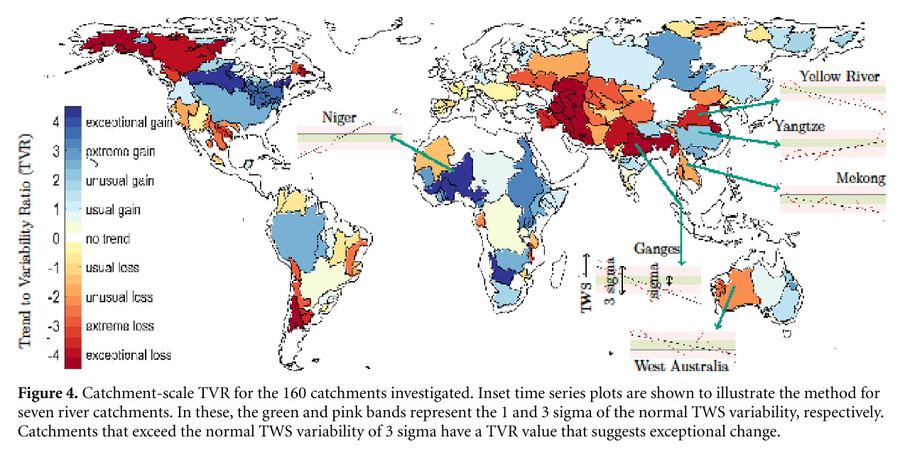
The authors suggested to use a new metric, named trend to variability ratio (TVR), when evaluating the severity of the change in the terrestrial water storage observations from GRACE satellite.
Novelty: TVR
Many studies and myself, too, are evaluating the trend of water storage change solely based on the slope of a regression model.
The authors challenged this method, insisting that the trend only cannot account for the natural variability of each grid (or region, continent, …). To tackle this problem, they made a normalized metric, named TVR:
trend (= slope in mm yr-1) x n (= the number of years) / sigma (= multi-decadal natural IAV of TWS in mm)
To get the sigma, there are a number of ways including land surface models. The authors used the GRACE-REC by Humphrey et al., as LSMs has some issues either data availability or representativeness of the natural variability.
Interpretation
With regard to the interpretation, it’s quite similar with that of the z-score in statistics.
- |TVR| < 2: Expected range due to the multi-decadal natural variability. Between 5~95 percentile for a Gaussian distribution.
- 2 < |TVR| < 3: Experiencing an extreme, but not an unprecedented event (likely experienced in the past). Almost within 98% range in the distribution.
- 3 < |TVR|: Experiencing an exceptional and unprecedented event.
Some phrases
Precipitation moves approximately 6000 ± 1400 Gt of water every year between land and oceans.
- Maybe this is the right reason why I am analyzing in that spatial resolution.
GRACE products are known to have a coarse spatial resolution that is approximately 3◦
Alaska, the Caspian Sea, Northern India, Argentina, Chile, the Eastern Amazon, the High Plains Aquifer and California are hotspots of TWS loss. … Iran, North-East China, Kazakhstan, South-East Asia, and several catchments in Southern Africa are also experiencing abnormal TWS loss.

similar TWS trends have markedly different TVR values.